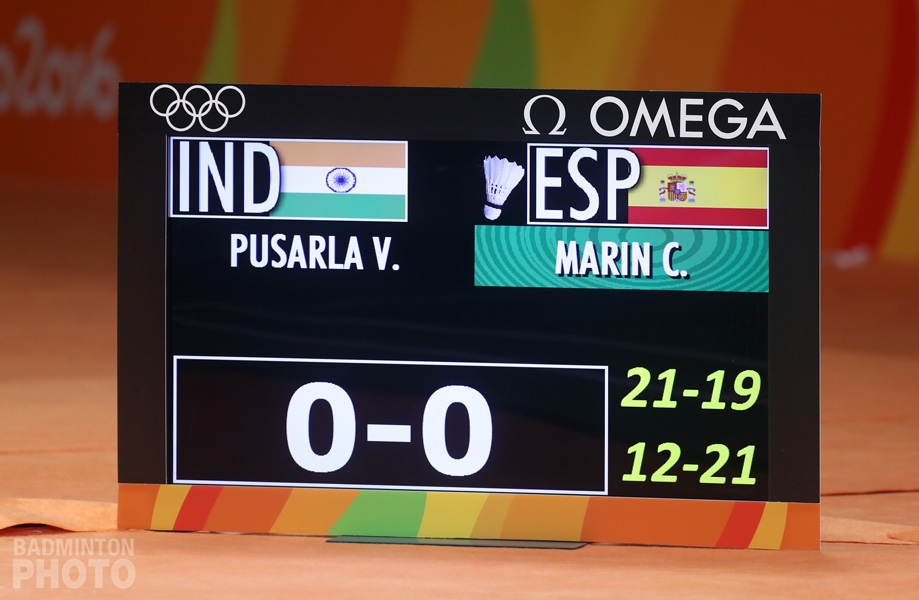
Nearly 30% of all badminton matches over the past 4 years went to 3 games. Of course, there is an even chance of winning a third game but if we look at each discipline separately, will we see any nuances that might suggest an edge in favour of the side with momentum or the one that regroups?
By Lim Kai Yi. Photos: Badmintonphoto
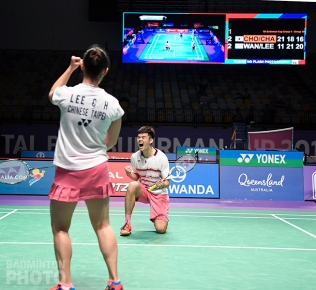
Have you ever wondered who is more likely to win a badminton match once it goes to three games? On one hand, it seems natural to assume that the player who has just won the second game should have the momentum or the confidence and they will take that through to the third game and win it too. On the other hand, players who have just fought back to even the match score at one game apiece, could instead feel that they are ‘out of the woods’, fail to maintain the intensity and let the final game slip away. But what will we find if we actually try running the numbers?
Abstract
The following analysis was undertaken to examine the probability of a player/pair winning the third and final game, given that they have won the 1st or 2nd game in the match.
Data was gathered from 4 years of badminton tournament data from the tournamentsoftware.com website. This period covers the last 4 seasons of Superseries tournaments before the introduction of BWF World Tour in 2018.
Each tournament was examined for errors, and then the data was processed into groups for each discipline and also into an overall total.
The overall probability was found to be very close to the mean of a 50% chance of either side winning the final game. However, when examining the data by discipline, it revealed trends that correlate with playing styles, tactics and strategies of each discipline. Both singles disciplines had a slight lean towards the winner being the player who won the 2nd game. It was also found that during the year of 2015, an Olympic qualification year, both women’s doubles and mixed doubles may have adapted a playing style closer to men’s doubles.
Introduction
In the sport of badminton, matches are decided by the best of 3 games system, as stated in the BWF Statutes 4.1, the Laws of Badminton:
7.1. A match shall consist of the best of three games, unless otherwise arranged.
This means a side must win 2 games in order to win, and should both sides win a game each, a third game is required in order to determine who can win the next game required for victory.
Assuming both sides have won a game each, it stands to reason that both sides are equal in ability and therefore are equally likely to win the final game. However, there are also many other factors in play too, like players’ remaining stamina, tactics, mental state, court environment, home crowd, etc.
This begets the question, who is more likely to win the final game: the side that won the first game, or the side that won the second?
We shall follow a systematic method of observation called the scientific method to find an answer to the question, by means of data analysis of matches from the last 4 Superseries seasons, from 2014 to 2017.
Hypothesis:
If both sides have won a game each, then it can be assumed that both sides are equal in ability and therefore both have an even chance (50%) to win the final game. This should hold true for all the disciplines of badminton, men’s singles, women’s singles, men’s doubles, women’s doubles and mixed doubles.
Method:
I developed a program that checked each tournament during a single playing year. For each tournament analysed, the data was checked for errors, then each match was analysed and checked for whether it was a 3-game match. If it was a 3-game match, then the match data was processed into the data pools.
Each 3-game match can be put into one of the following categories:
WLW – Won the first game, Lost the second game, Won the third game
LWW – Lost the first game, Won the second game, Won the third game
(Both of these are from the perspective of the winning side, but it is possible to interpret the inverse by inverting the letters.)
Once a tournament had its matches completely analysed, the function looked for matches that have 3 games and gathered the following data:
- Number of tournaments covered
- Number of matches total
- Total number of 3-game matches
- Total number of WLW
- Total number of LWW
- For each discipline
- Number of 3-game matches
- Number of WLW
- Number of LWW
An explanation of statistics:
As there are only 2 possible outcomes, the parameters follow a binomial distribution, which is the discrete probability distribution of each result in a sequence of independent experiments.
n – number of experiments/trials – in this case this will refer to the number of matches
p – probability of either side winning the final game, i.e. probability of WLW or LWW
Each match is independent of others – they do not affect match outcomes of other 3-game matches. It is assumed that probability of winning/losing is the same for each match.
For tournament processing, tournament data taken from the tournamentsoftware.com website was analysed carefully to find if there are any errors. With regards to score and time, potential errors are incomplete scores and missing match times. It is assumed that every completed match on Tournament Software has correct score and times.
Matches with incomplete scores were discarded in the interest of accuracy. However, if a tournament only has missing match times, the matches were included, as time is not an essential factor to consider in this study.
Tournament categories covered are Grand Prix, Grand Prix Gold, Superseries, Superseries Premier, individual World Championships and Olympic Games. International Challenges and International Series were not included due to the higher likelihood of encountering errors during processing.
Data was then separated into each discipline, and also added to a total overall per year. Years covered are 2014 – 2017.
Each percentage is rounded to the nearest 2 decimal places.
Assumptions, expectations and predictions:
If the hypothesis is correct, then we can expect the winning percentages of WLW and LWW (for each year and each discipline) to be within a certain margin of deviation from 50% chance i.e. 50% ± deviation. A standard deviation (SD) is calculated from the number of trials (n) and probability (p). In this binomial distribution, it will be calculated as:
It is assumed that p is 0.5 – 50% chance of either result.
Having a higher number of trials will reduce the deviation, as the percentages are expected to approach the 50% mark. SD is a measure used to quantify the amount of variation/dispersion of the data set. (for more, see here)
- 68.27% chance that the value lies within ± 1 SD of the mean.
- 95.45% chance that the value lies within ± 2 SD of the mean.
- 99.74% chance that the value lies within ± 3 SD of the mean.
Per year and Overall total – Due to the large number of matches covered per year, we can expect the winning percentages difference to fall with 1 SD from mean 50% chance: 50% ± 1 SD
Per discipline – As each discipline has different playing styles and tactics, we can expect a greater variance, which should not exceed 1.5 SD: 50% ± 1.5 SD.
Tournament Data
| Overall | 2017 | 2016 | 2015 | 2014 | |
| Tournaments | 123 | 30 | 31 | 35 | 27 |
| No. of matches | 23,070 | 6,118 | 5,574 | 6,479 | 4,899 |
Overall (all disciplines combined)
| 3-game matches | Overall | 2017 | 2016 | 2015 | 2014 |
| Total | 6,781 | 1,878 | 1,577 | 1,918 | 1,408 |
| % of total matches | 29.39 | 30.70 | 28.29 | 29.60 | 28.74 |
| Average no. of matches per tournament | 55.13 | 62.6 | 50.87 | 54.8 | 52.15 |
| WLW | 3,383 | 921 | 792 | 971 | 699 |
| % | 49.89 | 49.04 | 50.22 | 50.63 | 49.64 |
| LWW | 3,398 | 957 | 785 | 947 | 709 |
| % | 50.11 | 50.96 | 49.78 | 49.37 | 50.36 |
| % difference (50 – % of above) | 0.11 | 0.96 | 0.22 | 0.63 | 0.36 |
| binomial SD | 41.17341 | 21.66795 | 19.85573 | 21.89749 | 18.76166 |
| 1 SD as % of total | 0.61 | 1.15 | 1.26 | 1.14 | 1.33 |
| 2 SD as % of total | 1.21 | 2.31 | 2.52 | 2.28 | 2.67 |
| % difference / 1 SD % | 0.18 | 0.83 | 0.18 | 0.55 | 0.27 |
It can be observed that 3-game matches make up 28.3% to 30.7% of total matches per year. This suggests that there is a 29.4% chance of a match going to 3 games.
Total winning percentages for WLW and LWW per year are very close to the mean 50% chance, having less than 1% deviation, even with the SD providing a good 1.1% ~ 1.3% margin. As more results are gathered, the smaller the SD from mean 50% chance. As these totals cover all the disciplines, it follows that they should reflect the chance of winning the final match across all disciplines, which should approach 50%.
Men’s Singles
| MS | Overall | 2017 | 2016 | 2015 | 2014 |
| 3-game Matches | 2,056 | 538 | 479 | 599 | 440 |
| WLW | 985 | 251 | 230 | 284 | 220 |
| % | 47.91 | 46.65 | 48.02 | 47.41 | 50.00 |
| LWW | 1,071 | 287 | 249 | 315 | 220 |
| % | 52.09 | 53.35 | 51.98 | 52.59 | 50.00 |
| % difference | 2.09 | 3.35 | 1.98 | 2.59 | 0.00 |
| binomial SD | 22.67157 | 11.59741 | 10.94303 | 12.23724 | 10.48809 |
| 1 SD as % of total | 1.10 | 2.16 | 2.28 | 2.04 | 2.38 |
| 2 SD as % of total | 2.21 | 4.31 | 4.57 | 4.09 | 4.77 |
| % difference / 1 SD % | 1.90 | 1.55 | 0.87 | 1.27 | 0.00 |
With the exception of 2014, which showed an even split, men’s singles shows a lean towards LWW. The biggest difference is in 2017, which recorded a difference of 3.35%. This points to approximately 1.55 SD away from mean 50%, and also the total has a 1.9 SD away from mean. The probability of exceeding ± 1.5 SD is 13.36%, and exceeding ± 2 SD is 4.55%, which suggests a significant deviation; therefore there has to be a factor that is influencing the winning percentages of LWW. This will mean that a player winning the 2nd game is significantly more likely to win the final game than a player who has won the 1st game.
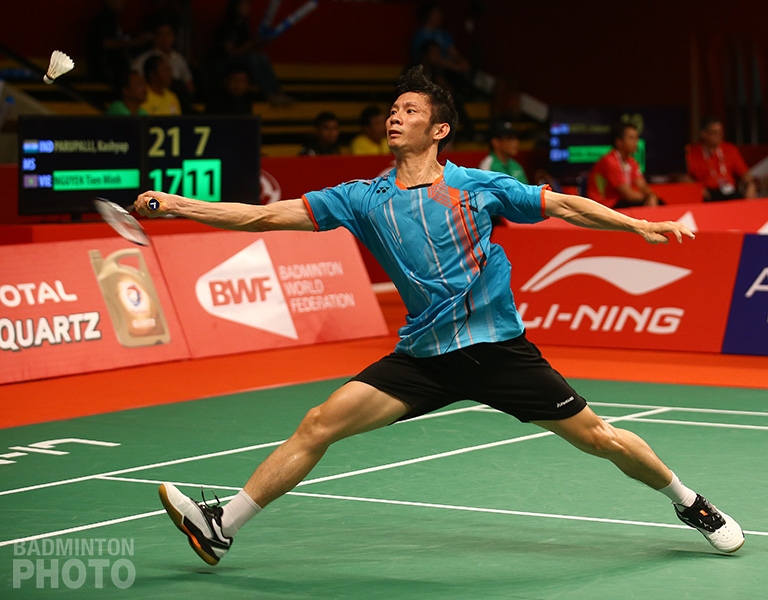
Hans Kristian Vittinghus, a men’s singles player shared his opinion of the data: “I would think it’s because you are going into the final game with momentum on your side as you just won the 2nd game. And I guess you will feel more confident after winning a game compared to if you just lost one.”
This suggests that the 2nd game winner has a psychological (mental) advantage going into the final game, having a confidence boost after the recent win. The other side will have a disadvantage in that they are now under pressure to win the final game to negate their 2nd game loss, and thus they may be more likely to commit mistakes during play. With these 2 factors together, makes it more likely for the 2nd game winner to take the final game, hence the increase in LWW.
Women’s Singles
| WS | Overall | 2017 | 2016 | 2015 | 2014 |
| 3-game Matches | 1290 | 348 | 304 | 388 | 250 |
| WLW | 625 | 166 | 146 | 192 | 121 |
| % | 48.45 | 47.70 | 48.03 | 49.48 | 48.40 |
| LWW | 665 | 182 | 158 | 196 | 129 |
| % | 51.55 | 52.30 | 51.97 | 50.52 | 51.60 |
| % difference | 1.55 | 2.30 | 1.97 | 0.52 | 1.60 |
| binomial SD | 17.95828 | 9.327379 | 8.717798 | 9.848858 | 7.905694 |
| 1 SD as % of total | 1.39 | 2.68 | 2.87 | 2.54 | 3.16 |
| 2 SD as % of total | 2.78 | 5.36 | 5.74 | 5.08 | 6.32 |
| % difference / 1 SD % | 1.11 | 0.86 | 0.69 | 0.20 | 0.51 |
Just like men’s singles, women’s singles has a lean towards LWW, however, the lean is smaller compared to men’s singles. The difference is smaller, with the biggest difference being 0.86 SD from mean in 2017 as compared to 1.55 SD for men’s singles. The probability of exceeding ±1 SD is 31.73%; however, the data consistently shows a lean towards LWW, suggesting that there is a slight advantage for a 2nd game winner to win the final game.
As stated before, there is a psychological advantage for a 2nd game winner that can help her take the final game, however statistical data shows a smaller advantage compared to the men’s singles discipline. This could be due to a difference in pace of rallies, and different tactics involved between the two singles disciplines which reduce the psychological advantage.
Men’s Doubles
| MD | Overall | 2017 | 2016 | 2015 | 2014 |
| 3-game Matches | 1331 | 371 | 311 | 366 | 283 |
| WLW | 702 | 201 | 167 | 194 | 140 |
| % | 52.74 | 54.18 | 53.70 | 53.01 | 49.47 |
| LWW | 629 | 170 | 144 | 172 | 143 |
| % | 47.26 | 45.82 | 46.30 | 46.99 | 50.53 |
| % difference | 2.74 | 4.18 | 3.70 | 3.01 | 0.53 |
| binomial SD | 18.24144 | 9.63068 | 8.817596 | 9.565563 | 8.411302 |
| 1 SD as % of total | 1.37 | 2.60 | 2.84 | 2.61 | 2.97 |
| 2 SD as % of total | 2.74 | 5.19 | 5.67 | 5.23 | 5.94 |
| % difference / 1 SD % | 2.00 | 1.61 | 1.30 | 1.15 | 0.18 |
2014 could be considered an outlier year, as the years 2015 to 2017 consistently show a lean towards WLW, with the lean always exceeding 1 SD. The amount of variance away from mean also increases by the year, from 2015‘s difference of 1.15 SD to 2017’s difference of 1.61 SD. Even the difference for the total sum of years hangs at 2 SD, and with a chance of 4.55% to exceed ± 2 SD, suggesting a strong significant deviation from mean.
This suggests a strong cause for a 1st game winner in men’s doubles having an advantage in the final game.
Vountus Indramawan, doubles coach for Malaysia suggested, “Since doubles is about speed and power, maybe they will go all out in the 1st game and then focus on recovery for the 2nd game.”
This would mean the pacing of doubles is much different from singles, with players playing a high intensity pace during the first game, slowing down in the second game, and then playing the 3rd game as needed. Doubles tend to be played at a faster pace than singles, with players focused on hitting the shuttle down at the opponents. An analogy about pacing would be to compare doubles to a sprinter who runs in quick bursts of speed with breaks between, while singles will be represented by a distance runner who can maintain a constant speed over a long time.
It is possible that there is a reduction in psychological advantage of one side over the other, as doubles players will have their partner to motivate each other throughout the match. As Vountus has stated, skilled players will rush to grab the 1st game, recover in the 2nd game, then they will at least have some energy recovered to power through the 3rd game, as compared to a pair who spent their energy winning the 2nd game but do not have enough time to recover their energy to play in the 3rd game.
Women’s Doubles
| WD | Overall | 2017 | 2016 | 2015 | 2014 |
| 3-game Matches | 859 | 261 | 186 | 242 | 170 |
| WLW | 431 | 127 | 93 | 128 | 83 |
| % | 50.17 | 48.66 | 50.00 | 52.89 | 48.82 |
| LWW | 428 | 134 | 93 | 114 | 87 |
| % | 49.83 | 51.34 | 50.00 | 47.11 | 51.18 |
| % difference | 0.17 | 1.34 | 0 | 2.89 | 1.18 |
| binomial SD | 14.65435 | 8.077747 | 6.819091 | 7.778175 | 6.519202 |
| 1 SD as % of total | 1.71 | 3.09 | 3.67 | 3.21 | 3.83 |
| 2 SD as % of total | 3.41 | 6.19 | 7.33 | 6.43 | 7.67 |
| % difference / 1 SD % | 0.10 | 0.43 | 0.00 | 0.90 | 0.31 |
Of all the different disciplines, women’s doubles has the least variance, with the total sum of years only having a difference of 0.1 SD. This could be due to the low number of matches, which contributed to having a higher SD. In 2017, women’s doubles matches made up only 15.36% of the total matches played that year compared to other disciplines which each made up 18 – 19% of total matches, while men’s singles accounted for 28% of total matches played.
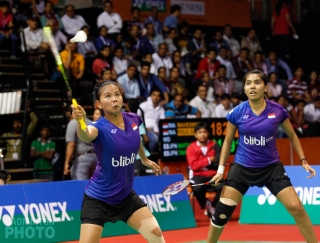
There is no clear lean towards either side, and even so, the biggest margin is just less than 1 SD away from mean. This shows the results of the previous two games do not have any significant influence on the result of the 3rd game. It could be explained that women’s doubles matches tend to be drawn out. In fact, the longest match of 2016 – though not included in this data set – was the Badminton Asia Championship women’s doubles semi-final between Naoko Fukuman / Kurumi Yonao and Nitya Krishinda Maheswari / Greysia Polii at 2 hours and 41 minutes. With each game being drawn out, each side will have a high energy expenditure; therefore strategy, tactics and careful usage of stamina could take priority over the advantage of winning the 1st or 2nd game.
Mixed Doubles
| XD | Overall | 2017 | 2016 | 2015 | 2014 |
| 3-game Matches | 1245 | 360 | 297 | 323 | 265 |
| WLW | 640 | 176 | 156 | 173 | 135 |
| % | 51.41 | 48.89 | 52.53 | 53.56 | 50.94 |
| LWW | 605 | 184 | 141 | 150 | 130 |
| % | 48.59 | 51.11 | 47.47 | 46.44 | 49.06 |
| % difference | 1.41 | 1.11 | 2.53 | 3.56 | 0.94 |
| binomial SD | 17.64228 | 9.486833 | 8.616844 | 8.9861 | 8.13941 |
| 1 SD as % of total | 1.42 | 2.64 | 2.90 | 2.78 | 3.07 |
| 2 SD as % of total | 2.83 | 5.27 | 5.80 | 5.56 | 6.14 |
| % difference / 1 SD % | 0.99 | 0.42 | 0.87 | 1.28 | 0.31 |
Compared to the other 3 years, 2015 shows a big jump in WLW, hovering at more than 1.28 SD while the other years do not even get past 1 SD from mean. This could be due to mixed pairs playing more intensely like men’s doubles as 2015 was a critical year for pairs to gain ranking points to qualify for the 2016 Olympic Games. The same could be said of women’s doubles, as 2015 was the only year with a greater variance in favour of WLW.
Mixed doubles has a higher complexity and depth of tactics, as the pair consist of 1 man and 1 woman, and the typical strategy is to create opportunities to shift the man to the back for attack and the woman to the front, while preventing the opposing pair from doing the same. It is this depth in tactics that hold a higher influence on winning the final game compared to the advantage of winning the 1st or 2nd game.
Conclusion and summary
Overall, with all disciplines combined over the past 4 years, 3-game matches make up an average of 29.39% of total matches per year. The total percentages of WLW and LWW keep very close to the mean of 50% chance, proving that there is an even chance of winning a third game if both sides have won one game each.
However, looking at each discipline separately, one can observe a few trends that reflect the nuances of each discipline. In both singles disciplines, there is a slightly higher chance for the winner of the 2nd game to win the final game. This is explained due to the psychological advantage from the confidence boost of winning the 2nd game, and the player who lost the 2nd game will enter the final game under mental pressure to take back the match. Men’s singles has a higher degree of variance towards LWW compared to women’s singles, which could be due to women’s singles focusing more on strategy and tactics to win the match.
For men’s doubles, there is a clear trend towards pairs who won the 1st game having a significant advantage in the final game. This could be due to the fast playing style of men’s doubles, akin to a sprinter who can sprint in bursts with breaks in between. Therefore a pair who won the 2nd game will actually be at a disadvantage in the final game as they will have no chance to catch their breath compared to the pair who won the 1st game and had the chance to use the 2nd game to recover their stamina.
Both women’s doubles and mixed doubles show no clear trend in in WLW/LWW, which could be due to a bigger emphasis in tactical play compared to the intensive play of men’s doubles. However, 2015 is a notable year in that both disciplines displayed a similar trend to men’s doubles, with a slightly higher percentage of WLW, and bigger variance compared to other years. 2015 was a critical year for all badminton players, as it was the year to gather ranking points to qualify for the 2016 Olympics. Therefore, during that year, both women’s doubles and mixed doubles pairs would have played more aggressively like men’s doubles, as each match carried more weight towards their playing careers, which would lead to the data trend matching the trend of men’s doubles.
It would be possible to analyse data from previous years to get a bigger sample size for overall total of years; however there may be a relevance issue, as players come and go, and playing tactics and strategies change over the course of time. There may also be an issue with data accuracy, as there were more errors observed in online data from earlier years.
Of course, badminton players of the world will understand that this is only a statistical analysis of previous matches and cannot be treated as a definitive guide of who will win or lose the final game. In other words, no men’s singles player should be taking from this that he has any extra advantage after bouncing back to win a second game. The match is never over until the last shuttle hits the floor.
Acknowledgements
This author would like to acknowledge and thank the following people who made significant contributions to this study:
Hans-Kristian Solberg Vittinghus, badminton player, Denmark – for his firsthand insight into the playing styles of men’s singles
Vountus Indramawan, badminton coach, Malaysia – for his valuable insight in pace and tactics of men’s doubles
Disclaimer: This author is by no means a professional statistician, however has attempted to closely follow the workflow of scientific method. Feedback is welcome in the comment section.
![Final game, love-all, play: the probability of winning a deciding game Nearly 30% of all badminton matches over the past 4 years went to 3 games. Of course, there is an even chance of winning a third game but if we […]](https://www.badzine.net/wp-content/uploads/ngg_featured/20160819_1156_OlympicGames2016_Yves2048_rotator.jpg)








Leave a Reply